
Portal:World
The World Portal


The world is the totality of entities, the whole of reality, or everything that exists. The nature of the world has been conceptualized differently in different fields. Some conceptions see the world as unique while others talk of a "plurality of worlds". Some treat the world as one simple object while others analyze the world as a complex made up of parts.
In scientific cosmology, the world or universe is commonly defined as "[t]he totality of all space and time; all that is, has been, and will be". Theories of modality talk of possible worlds as complete and consistent ways how things could have been. Phenomenology, starting from the horizon of co-given objects present in the periphery of every experience, defines the world as the biggest horizon or the "horizon of all horizons". In philosophy of mind, the world is contrasted with the mind as that which is represented by the mind. Theology conceptualizes the world in relation to God, for example, as God's creation, as identical to God or as the two being interdependent. In religions, there is a tendency to downgrade the material or sensory world in favor of a spiritual world to be sought through religious practice. A comprehensive representation of the world and our place in it, as is found in religions, is known as a worldview. Cosmogony is the field that studies the origin or creation of the world while eschatology refers to the science or doctrine of the last things or of the end of the world.
In various contexts, the term "world" takes a more restricted meaning associated, for example, with the Earth and all life on it, with humanity as a whole or with an international or intercontinental scope. In this sense, world history refers to the history of humanity as a whole and world politics is the discipline of political science studying issues that transcend nations and continents. Other examples include terms such as "world religion", "world language", "world government", "world war", "world population", "world economy", or "world championship". (Full article...)
Selected articles -
-

Global dimming is a decline in the amount of sunlight reaching the Earth's surface. It is caused by atmospheric particulate matter, predominantly sulfate aerosols, which are components of air pollution. Global dimming was observed soon after the first systematic measurements of solar irradiance began in the 1950s. This weakening of visible sunlight proceeded at the rate of 4–5% per decade until the 1980s. During these years, air pollution increased due to post-war industrialization. Solar activity did not vary more than the usual during this period.
As aerosols have a cooling effect, global dimming has masked the extent of global warming experienced to date, with the most-polluted regions even experiencing cooling in the 1970s. Global dimming has interfered with the water cycle by lowering evaporation, and thus has probably reduced rainfall in certain areas. It may have weakened the Monsoon of South Asia and caused the entire tropical rain belt to shift southwards between 1950 and 1985, with a limited recovery afterwards. Record levels of particulate pollution in the Northern Hemisphere caused or at least exacerbated the monsoon failure behind the 1984 Ethiopian famine. (Full article...) -

Atlantic Ocean near the Faroe Islands.
A sea is a large body of salty water. There are particular seas and the sea. The sea commonly refers to the ocean, the wider body of seawater.
Particular seas are either marginal seas, second-order sections of the oceanic sea (e.g. the Mediterranean Sea), or certain large, nearly landlocked bodies of water.
The salinity of water bodies varies widely, being lower near the surface and the mouths of large rivers and higher in the depths of the ocean; however, the relative proportions of dissolved salts vary little across the oceans. The most abundant solid dissolved in seawater is sodium chloride. The water also contains salts of magnesium, calcium, potassium, and mercury, amongst many other elements, some in minute concentrations. (Full article...) -
The retreat of glaciers since 1850 is well documented and is one of the effects of climate change. The retreat of mountain glaciers, notably in western North America, Asia, the Alps and tropical and subtropical regions of South America, Africa and Indonesia, provide evidence for the rise in global temperatures since the late 19th century. The acceleration of the rate of retreat since 1995 of key outlet glaciers of the Greenland and West Antarctic ice sheets may foreshadow a rise in sea level, which would affect coastal regions. Excluding peripheral glaciers of ice sheets, the total cumulated global glacial losses over the 26-year period from 1993 to 2018 were likely 5500 gigatons, or 210 gigatons per yr.
Deglaciation occurs naturally at the end of ice ages, but glaciologists find the current glacier retreat is accelerated by the measured increase of atmospheric greenhouse gases and is thus effect of climate change. Glacier mass balance is the key determinant of the health of a glacier. If the amount of frozen precipitation in the accumulation zone exceeds the quantity of glacial ice lost due to melting or in the ablation zone a glacier will advance; if the accumulation is less than the ablation, the glacier will retreat. Glaciers in retreat will have negative mass balances, and if they do not find an equilibrium between accumulation and ablation, will eventually disappear. (Full article...) -
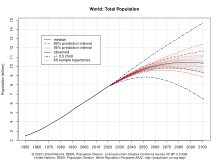
High, medium, and low projections of the future human world population
In world demographics, the world population is the total number of humans currently living. It was estimated by the United Nations to have exceeded eight billion in mid-November 2022. It took around 300,000 years of human prehistory and history for the human population to reach a billion and only 222 years more to reach 8 billion.
The human population has experienced continuous growth following the Great Famine of 1315–1317 and the end of the Black Death in 1350, when it was nearly 370,000,000. The highest global population growth rates, with increases of over 1.8% per year, occurred between 1955 and 1975, peaking at 2.1% between 1965 and 1970. The growth rate declined to 1.1% between 2015 and 2020 and is projected to decline further in the 21st century. The global population is still increasing, but there is significant uncertainty about its long-term trajectory due to changing fertility and mortality rates. The UN Department of Economics and Social Affairs projects between 9 and 10 billion people by 2050 and gives an 80% confidence interval of 10–12 billion by the end of the 21st century, with a growth rate by then of zero. Other demographers predict that the human population will begin to decline in the second half of the 21st century. (Full article...) -
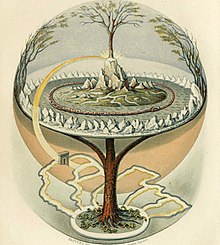
Yggdrasil, a modern attempt to reconstruct the Norse world tree which connects the heavens, the earth and the underworld
The underworld, also known as the netherworld or hell, is the supernatural world of the dead in various religious traditions and myths, located below the world of the living. Chthonic is the technical adjective for things of the underworld.
The concept of an underworld is found in almost every civilization and "may be as old as humanity itself". Common features of underworld myths are accounts of living people making journeys to the underworld, often for some heroic purpose. Other myths reinforce traditions that the entrance of souls to the underworld requires a proper observation of ceremony, such as the ancient Greek story of the recently dead Patroclus haunting Achilles until his body could be properly buried for this purpose. People with high social status were dressed and equipped in order to better navigate the underworld. (Full article...) -

Global average temperatures show that the Medieval Warm Period was not a planet-wide phenomenon, and that the Little Ice Age was not a distinct planet-wide time period but rather the end of a long temperature decline that preceded recent global warming.
The temperature record of the last 2,000 years is reconstructed using data from climate proxy records in conjunction with the modern instrumental temperature record which only covers the last 170 years at a global scale. Large-scale reconstructions covering part or all of the 1st millennium and 2nd millennium have shown that recent temperatures are exceptional: the Intergovernmental Panel on Climate Change Fourth Assessment Report of 2007 concluded that "Average Northern Hemisphere temperatures during the second half of the 20th century were very likely higher than during any other 50-year period in the last 500 years and likely the highest in at least the past 1,300 years." The curve shown in graphs of these reconstructions is widely known as the hockey stick graph because of the sharp increase in temperatures during the last century. this broad pattern was supported by more than two dozen reconstructions, using various statistical methods and combinations of proxy records, with variations in how flat the pre-20th-century "shaft" appears. Sparseness of proxy records results in considerable uncertainty for earlier periods.
Individual proxy records, such as tree ring widths and densities used in dendroclimatology, are calibrated against the instrumental record for the period of overlap. Networks of such records are used to reconstruct past temperatures for regions: tree ring proxies have been used to reconstruct Northern Hemisphere extratropical temperatures (within the tropics trees do not form rings) but are confined to land areas and are scarce in the Southern Hemisphere which is largely ocean. Wider coverage is provided by multiproxy reconstructions, incorporating proxies such as lake sediments, ice cores and corals which are found in different regions, and using statistical methods to relate these sparser proxies to the greater numbers of tree ring records. The "Composite Plus Scaling" (CPS) method is widely used for large-scale multiproxy reconstructions of hemispheric or global average temperatures; this is complemented by Climate Field Reconstruction (CFR) methods which show how climate patterns have developed over large spatial areas, making the reconstruction useful for investigating natural variability and long-term oscillations as well as for comparisons with patterns produced by climate models. (Full article...) -
Climate change mitigation (or decarbonisation) is action to limit the greenhouse gases in the atmosphere that cause climate change. Greenhouse gas emissions are primarily caused by people burning fossil fuels such as coal, oil, and natural gas. Phasing out fossil fuel use can happen by conserving energy and replacing fossil fuels with clean energy sources such as wind, hydro, solar, and nuclear power. Secondary mitigation strategies include changes to land use and removing carbon dioxide (CO2) from the atmosphere. Governments have pledged to reduce greenhouse gas emissions, but actions to date are insufficient to avoid dangerous levels of climate change.
Solar energy and wind power have the greatest potential for supplanting fossil fuels at the lowest cost compared to other options. The availability of sunshine and wind is variable and can require electrical grid upgrades, such as using long-distance electricity transmission to group a range of power sources. Energy storage can also be used to even out power output, and demand management can limit power use when power generation is low. Cleanly generated electricity can usually replace fossil fuels for powering transportation, heating buildings, and running industrial processes. Certain processes are more difficult to decarbonise, such as air travel and cement production. Carbon capture and storage (CCS) can be an option to reduce net emissions in these circumstances, although fossil fuel power plants with CCS technology have not yet proven economical. (Full article...)


General images -
-
 Ajloun Castle, Jordan
 -
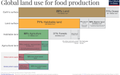 Earth's land use for human agriculture in 2019 (from Earth)
 -
 Artist's impression of Earth during the later Archean, the largely cooled planetary crust and water-rich barren surface, marked by volcanoes and continents, features already round microbialites. The Moon, still orbiting Earth much closer than today and still dominating Earth's sky, produced strong tides. (from History of Earth)
 -
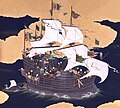 Japanese depiction of a Portuguese carrack. European maritime innovations led to proto-globalization.
 -

-
-
 Dinosaurs were the dominant terrestrial vertebrates throughout most of the Mesozoic (from History of Earth)
 -
-
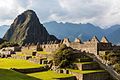 Machu Picchu, Inca Empire, Peru
 -
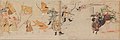 Battle during 1281 Mongol invasion of Japan
 -
 View of Earth from the Moon by the Lunar Reconnaissance Orbiter (from Earth)
 -
-
 Notre-Dame de Paris, France
 -
 Persepolis, Achaemenid Empire, 6th century BCE
 -

-
 An animation of the changing density of productive vegetation on land (low in brown; heavy in dark green) and phytoplankton at the ocean surface (low in purple; high in yellow) (from Earth)
 -
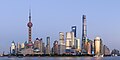 Shanghai. China urbanized rapidly in the 21st century.
 -

-
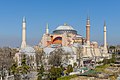
 The Pantheon, originally a Roman temple, now a Catholic church
 -
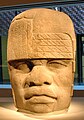 Olmec colossal head, now at the Museo de Antropología de Xalapa
 -
 Earth's night-side upper atmosphere appearing from the bottom as bands of afterglow illuminating the troposphere in orange with silhouettes of clouds, and the stratosphere in white and blue. Next the mesosphere (pink area) extends to the orange and faintly green line of the lowest airglow, at about one hundred kilometers at the edge of space and the lower edge of the thermosphere (invisible). Continuing with green and red bands of aurorae stretching over several hundred kilometers. (from Earth)
 -
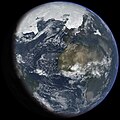
 A composite image of Earth, with its different types of surface discernible: Earth's surface dominating Ocean (blue), Africa with lush (green) to dry (brown) land and Earth's polar ice in the form of Antarctic sea ice (grey) covering the Antarctic or Southern Ocean and the Antarctic ice sheet (white) covering Antarctica. (from Earth)
 -
 A schematic view of Earth's magnetosphere with solar wind flowing from left to right (from Earth)
 -
 First airplane, the Wright Flyer, flew on 17 December 1903.
 -
 A reconstruction of Pannotia (550 Ma). (from History of Earth)
 -
-
 Artist's conception of Devonian flora (from History of Earth)
 -
 Lithified stromatolites on the shores of Lake Thetis, Western Australia. Archean stromatolites are the first direct fossil traces of life on Earth. (from History of Earth)
 -

-
 Graph showing range of estimated partial pressure of atmospheric oxygen through geologic time (from History of Earth)
 -
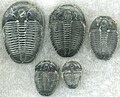 Trilobites first appeared during the Cambrian period and were among the most widespread and diverse groups of Paleozoic organisms. (from History of Earth)
 -
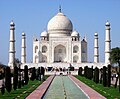 Taj Mahal, Mughal Empire, India
 -
 Pale orange dot, an artist's impression of Early Earth, featuring its tinted orange methane-rich early atmosphere (from Earth)
 -
 A pillar at Göbekli Tepe
 -
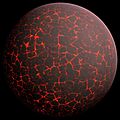
The pale orange dot, an artist's impression of the early Earth which might have appeared orange through its hazy methane rich prebiotic second atmosphere. Earth's atmosphere at this stage was somewhat comparable to today's atmosphere of Titan. (from History of Earth)
-

-
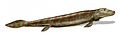 Tiktaalik, a fish with limb-like fins and a predecessor of tetrapods. Reconstruction from fossils about 375 million years old. (from History of Earth)
 -
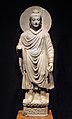 Standing Buddha from Gandhara, 2nd century CE
 -
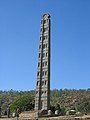 Obelisk of Axum, Ethiopia
 -
 A 2012 artistic impression of the early Solar System's protoplanetary disk from which Earth and other Solar System bodies were formed (from Earth)
 -
 Change in average surface air temperature and drivers for that change. Human activity has caused increased temperatures, with natural forces adding some variability. (from Earth)
 -
 Earth's history with time-spans of the eons to scale (from History of Earth)
 -
 A reconstruction of human history based on fossil data. (from History of Earth)
 -
 Artist's conception of Hadean Eon Earth, when it was much hotter and inhospitable to all forms of life. (from History of Earth)
 -
 Tracy Caldwell Dyson, a NASA astronaut, observing Earth from the Cupola module at the International Space Station on 11 September 2010 (from Earth)
 -
-
 Yggdrasil, an attempt to reconstruct the Norse world tree which connects the heavens, the world, and the underworld. (from World)
 -
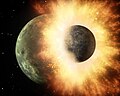 Artist's impression of the enormous collision that probably formed the Moon (from History of Earth)
 -
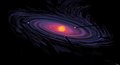
 Image of the physical world, captured by the Hubble Space Telescope (from World)
 -

-
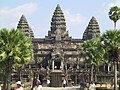 Angkor Wat temple complex, Cambodia, early 12th century
 -
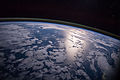 A view of Earth with different layers of its atmosphere visible: the troposphere with its clouds casting shadows, a band of stratospheric blue sky at the horizon, and a line of green airglow of the lower thermosphere around an altitude of 100 km, at the edge of space (from Earth)
 -

-
 Empires of the world in 1898
 -
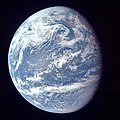 A view of Earth with its global ocean and cloud cover, which dominate Earth's surface and hydrosphere; at Earth's polar regions, its hydrosphere forms larger areas of ice cover. (from Earth)
 -
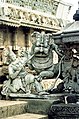 Chennakesava Temple, Belur, India
 -
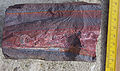 A banded iron formation from the 3.15 Ga Moodies Group, Barberton Greenstone Belt, South Africa. Red layers represent the times when oxygen was available; gray layers were formed in anoxic circumstances. (from History of Earth)
 -

-
-
 A map of heat flow from Earth's interior to the surface of Earth's crust, mostly along the oceanic ridges (from Earth)
 -
 Map of peopling of the world (Southern Dispersal paradigm), in thousands of years ago.
 -
 An artist's rendering of a protoplanetary disk (from History of Earth)
 -
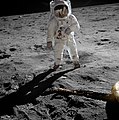
 Last Moon landing: Apollo 17 (1972)
 -
 Florence, birthplace of the Italian Renaissance
 -
 A 580 million year old fossil of Spriggina floundensi, an animal from the Ediacaran period. Such life forms could have been ancestors to the many new forms that originated in the Cambrian Explosion. (from History of Earth)
 -

-
 Pangaea was a supercontinent that existed from about 300 to 180 Ma. The outlines of the modern continents and other landmasses are indicated on this map. (from History of Earth)
 -
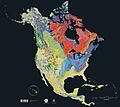 Geologic map of North America, color-coded by age. From most recent to oldest, age is indicated by yellow, green, blue, and red. The reds and pinks indicate rock from the Archean.
 -
 Chloroplasts in the cells of a moss (from History of Earth)
 -

-
 Satellite time lapse imagery of Earth's rotation showing axis tilt (from Earth)
 -
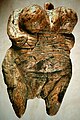
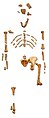 "Lucy", the first Australopithecus afarensis skeleton found. Lucy was only 1.06 m (3 ft 6 in) tall.
 -
 Vitruvian Man by Leonardo da Vinci epitomizes the advances in art and science seen during the Renaissance. (from History of Earth)
 -
-
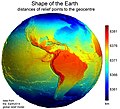 Earth's western hemisphere showing topography relative to Earth's center instead of to mean sea level, as in common topographic maps (from Earth)
 -
 Cross-section through a liposome (from History of Earth)
 -
 A Benin Bronze head from Nigeria
 -
An artist's impression of the Archean, the eon after Earth's formation, featuring round stromatolites, which are early oxygen-producing forms of life from billions of years ago. After the Late Heavy Bombardment, Earth's crust had cooled, its water-rich barren surface is marked by continents and volcanoes, with the Moon still orbiting Earth half as far as it is today, appearing 2.8 times larger and producing strong tides. (from Earth)
-
 Great Pyramids of Giza, Egypt
 -
 Artist's rendition of an oxinated fully-frozen Snowball Earth with no remaining liquid surface water. (from History of Earth)
 -
 The replicator in virtually all known life is deoxyribonucleic acid. DNA is far more complex than the original replicator and its replication systems are highly elaborate. (from History of Earth)
 -
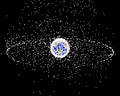 A computer-generated image mapping the prevalence of artificial satellites and space debris around Earth in geosynchronous and low Earth orbit (from Earth)
 -
 Great Mosque of Kairouan, Tunisia, founded 670 CE
 -
 Ming dynasty section, Great Wall of China
 -
-
 A composite image of artificial light emissions at night on a map of Earth (from Earth)
 -
 Earth's axial tilt causing different angles of seasonal illumination at different orbital positions around the Sun (from Earth)
 -
 Fall of the Berlin Wall, 1989
 -
-
-
 An artist's impression of ice age Earth at glacial maximum. (from History of Earth)
 -
 Artist's impression of a Hadean landscape with the relatively newly formed Moon still looming closely over Earth and both bodies sustaining strong volcanism. (from History of Earth)


.svg)


.jpg)


.jpeg)


.jpg)


.jpg)


Megacities of the world -

Delhi, officially the National Capital Territory (NCT) of Delhi, is a city and a union territory of India containing New Delhi, the capital of India. Lying on both sides of the Yamuna river, but chiefly to the west, or beyond its right bank, Delhi shares borders with the state of Uttar Pradesh in the east and with the state of Haryana in the remaining directions. Delhi became a union territory on 1 November 1956 and the NCT in 1995. The NCT covers an area of 1,484 square kilometres (573 sq mi). According to the 2011 census, Delhi's city proper population was over 11 million, while the NCT's population was about 16.8 million.
Delhi's urban agglomeration, which includes the satellite cities Ghaziabad, Faridabad, Gurgaon, Noida, Greater Noida and YEIDA city located in an area known as the National Capital Region (NCR), has an estimated population of over 28 million, making it the largest metropolitan area in India and the second-largest in the world (after Tokyo). (Full article...)Did you know -

- ... that the joint National War Fund was created during World War II so that American citizens would not get annoyed by multiple donation requests for service members' support and overseas relief?
- ... that the Baratal limestone in Russia may be one of the oldest atolls in the world?
- ... that, in addition to the Armenians, the Assyrians also faced genocide in the Ottoman Empire during World War I?
- ... that poker player Ema Zajmović received a wrestling-style belt when she won a World Poker Tour event in Montreal?
- ... that deleted articles on Wikipedia may be "salted" so that they cannot be recreated?
- ... that the San Diego Trough Fault Zone can produce an earthquake that devastates the counties of Los Angeles, Orange, and San Diego, California?
- ... that Columbia Eneutseak, named for the World's Columbian Exposition where she was born into one of the exhibits, starred in her film The Way of the Eskimo?
- ... that Charles Irving's apparatus for the distillation of seawater was used during James Cook's 1772–1775 voyage round the world?
Countries of the world -

Pakistan, officially the Islamic Republic of Pakistan, is a country in South Asia. It is the fifth-most populous country, with a population of over 241.5 million, having the second-largest Muslim population as of 2023. Islamabad is the nation's capital, while Karachi is its largest city and financial centre. Pakistan is the 33rd-largest country by area and the ninth-largest in Asia. Bounded by the Arabian Sea on the south, the Gulf of Oman on the southwest, and the Sir Creek on the southeast, it shares land borders with India to the east; Afghanistan to the west; Iran to the southwest; and China to the northeast. It shares a maritime border with Oman in the Gulf of Oman, and is separated from Tajikistan in the northwest by Afghanistan's narrow Wakhan Corridor.
Pakistan is the site of several ancient cultures, including the 8,500-year-old Neolithic site of Mehrgarh in Balochistan, the Indus Valley civilisation of the Bronze Age, and the ancient Gandhara civilisation. The regions that comprise the modern state of Pakistan were the realm of multiple empires and dynasties, including the Achaemenid, the Maurya, the Kushan, the Gupta; the Umayyad Caliphate in its southern regions, the Samma, the Hindu Shahis, the Shah Miris, the Ghaznavids, the Delhi Sultanate, the Mughals, and most recently, the British Raj from 1858 to 1947. (Full article...)Related portals
Protected areas of the world -
-

A view of Kaptai National Park
This is a list of protected areas of Bangladesh. Bangladesh is a country in South Asia. It is the eighth-most populous country in the world, with a population exceeding 163 million people in an area of either 148,460 square kilometres (57,320 sq mi) or 147,570 square kilometres (56,980 sq mi), making it one of the most densely populated countries in the world. (Full article...) -
Protected areas of Tasmania consist of protected areas located within Tasmania and its immediate onshore waters, including Macquarie Island. It includes areas of crown land (withheld land) managed by Tasmanian Government agencies as well as private reserves. As of 2016, 52% of Tasmania's land area has some form of reservation classification, the majority is managed by the Tasmania Parks & Wildlife Service (about 42% of total Tasmanian land area). Marine protected areas cover about 7.9% of state waters.
Within each classification of reserve there may be a variation of IUCN categories Australia is a signatory to the Convention of Biological Diversity and as such has obligations to report the status of its National Reserve System.IUCN provides on its website a prescription for activities consistent with the categorisation system. Changes made to the Nature Conservation Act 2002 in 2014 permit timber harvesting. These changes made in addition to the already established right to access minerals means that many of the IUCN categorisations assigned to individual reserves in Tasmania are no longer fit for purpose. In addition many reserves have had their reserve status downgraded from a class excluding timber harvesting and mineral extraction to ones where these activities are now permitted. This mis-application of the IUCN protected area categories needs to be remedied or the reserves protected land class under the Nature Conservation Act 2002 should be adjusted to reflect its currently assigned IUCN category. (Full article...) -
This is a list of protected areas of Yukon. The Yukon, formerly called Yukon Territory and sometimes referred to as just Yukon is the smallest and westernmost of Canada's three territories. It also is the least populated province or territory in Canada, with a population of 35,874 people as of the 2016 Census. (Full article...) -
The protected areas of Michigan come in an array of different types and levels of protection. Michigan has five units of the National Park Service system. There are 14 federal wilderness areas; the majority of these are also tribal-designated wildernesses. It has one of the largest state forest systems as well having four national forests. The state maintains a large state park system and there are also regional parks, and county, township and city parks. Still other parks on land and in the Great Lakes are maintained by other governmental bodies. Private protected areas also exist in the state, mainly lands owned by land conservancies. (Full article...)
-

Mombacho Volcano Natural Reserve
The protected areas of Nicaragua are areas that have natural beauty or significance and are protected by Nicaragua. Nicaragua has 78 protected areas that cover 22,422 km2, about 17.3% of the nations landmass. The National System of Protected Areas (SINAP) is administered by the Ministry of the Environment and Natural Resources (MARENA). (Full article...) -
This is a list of protected areas of Saudi Arabia, some of which are managed by the Saudi Wildlife Authority.:
- At-Taysiyah Protected Area
- Jabal Shada Nature Reserve
- Majami'al-Hadb Protected Area
- Nafud al-'Urayq
- Raydah Natural Reserve
- 'Uruq Bani Ma'arid
- Saja Umm Ar-Rimth Natural Reserve
- Harrat al-Harrah Protected Area
- Al-Khunfah Natural Reserve
- Ibex Reserve Protected Area
- Mahazat as-Sayd Protected Area
- Umm al-Qamari Islands
- Al-Tubayq Natural Reserve
- Farasan Islands Protected Area
- Jubail Marine Wildlife Sanctuary
- Jabal Aja Protected Area
- Wadi Turabah Nature Reserve
-

A view at Kintrishi National Park
The South Caucasian nation of Georgia is home to several protected areas, which receive protection because of their environmental, cultural or similar value. The oldest of these – now known as the Lagodekhi Protected Areas – dates back to 1912, when Georgia was part of the Russian Empire.
The total area of Georgia's protected terrestrial territories is 6,501 km2 (2,510 sq mi), which amounts to approximately 9.29% of the country's territory. In addition 153 km2 (59 sq mi) of marine area protected, or 0.67% of the country's territorial waters. There are a total of 89 protected areas, including 14 Strict Nature Reserves, 12 National Parks, 20 Managed Nature Reserves, 40 Natural Monuments, 2 Ramsar sites and 1 Protected Landscape. Strict nature reserves comprise 140,672 ha, while national parks cover 276,724 ha. The total number of visitors to Georgia's protected areas was just under 1.2 million in 2019. (Full article...) -

Vegetation outside Goz Beïda
The wildlife of Chad is composed of its flora and fauna. Bush elephants, West African lions, buffalo, hippopotamuses, Kordofan giraffes, antelopes, African leopards, cheetahs, hyenas, and many species of snakes are found there, although most large carnivore populations have been drastically reduced since the early 20th century. Elephant poaching, particularly in the south of the country in areas such as Zakouma National Park, is a severe problem. (Full article...) -
This list of protected areas of Quebec includes federally, provincially and municipally administered parks and wildlife reserves in Quebec, the largest province in Canada. (Full article...) -
 National parks of Victoria
  State parks of Victoria
  Marine national parks of Victoria
  Marine and coastal parks of Victoria
  Marine sanctuaries of Victoria
  Other parks of Victoria


The following is a list of protected areas of Burkina Faso. (Full article...)
Protected areas of the United Kingdom are areas in the United Kingdom which need and /or receive protection because of their environmental, historical or cultural value to the nation. Methods and aims of protection vary depending on the nature and importance of the resource. Protection operates at local, regional, national and international levels, and may be backed by legislation and international treaty, or less formally by planning policy.
Within the United Kingdom, different approaches are taken to some forms of protection within the constituent countries of England, Scotland, Wales and Northern Ireland, while other forms of protection are more consistent across the UK. Protected areas can be divided according to the type of resource which each seeks to protect. Primarily, these are: scenic or landscape value; biodiversity value (species and habitats); geodiversity value (relating to geology and geomorphology); and cultural or historic value. Several types of protected areas are focused on more than one of these areas. (Full article...)
Selected world maps
-
 Time zones of the world
 -
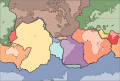
 A plate tectonics map with volcano locations indicated with red circles
 -
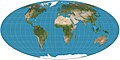 Mollweide projection of the world
 -
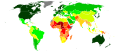 United Nations Human Development Index map by country (2016)
 -
 The world map by Gerardus Mercator (1569), the first map in the well-known Mercator projection
 -
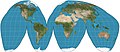 The Goode homolosine projection is a pseudocylindrical, equal-area, composite map projection used for world maps.
 -
 1516 map of the world by Martin Waldseemüller
 -
 Index map from the International Map of the World (1:1,000,000 scale)
 -
 Only a few of the largest large igneous provinces appear (coloured dark purple) on this geological map, which depicts crustal geologic provinces as seen in seismic refraction data


World records
- List of Olympic records in athletics
- List of world records in athletics
- List of junior world records in athletics
- List of world records in masters athletics
- List of world youth bests in athletics
- List of IPC world records in athletics
- List of world records in canoeing
- List of world records in chess
- List of cycling records
- List of world records in track cycling
- List of world records in finswimming
- List of world records in juggling
- List of world records in rowing
- List of world records in speed skating
- List of world records in swimming
- List of IPC world records in swimming
- List of world records in Olympic weightlifting
Topics
Continents of Earth | ||||||||
|---|---|---|---|---|---|---|---|---|
| ||||||||
| ||||||||
| ||||||||


| Cenozoic Era (present–66.0 Ma) |
| ||||||||||||
|---|---|---|---|---|---|---|---|---|---|---|---|---|---|
| Mesozoic Era (66.0–252 Ma) |
| ||||||||||||
| Paleozoic Era (252–539 Ma) |
| ||||||||||||
| Proterozoic Eon (539 Ma–2.5 Ga) |
| ||||||||||||
| Archean Eon (2.5–4 Ga) | |||||||||||||
| Hadean Eon (4–4.6 Ga) | |||||||||||||
ka = kiloannum (thousands years ago); Ma = megaannum (millions years ago); Ga = gigaannum (billions years ago). See also: Geologic time scale • | |||||||||||||
| Locations | ||
|---|---|---|
| Related | ||

| |||||||||||||||||||
| |||||||||||||||||||
| |||||||||||||||||||

Economic classification of countries | |||||
|---|---|---|---|---|---|
| Three-World Model | |||||
| Gross domestic product (GDP) |
| ||||
| Gross national income (GNI) | |||||
| Wages | |||||
| Wealth | |||||
| Other national accounts | |||||
| Human development | |||||
| Digital divide | |||||
| Net international investment position (NIIP) | |||||
| Technological |
| ||||
|---|---|---|---|---|---|
| Sociological | |||||
| Ecological |
| ||||
| Biological |
| ||||
| Astronomical | |||||
| Eschatological |
| ||||
| Others |
| ||||
| Fictional | |||||
| Organizations | |||||
Categories

Wikimedia
The following Wikimedia Foundation sister projects provide more on this subject:
-
 Commons
Free media repository -
 Wikibooks
Free textbooks and manuals -
 Wikidata
Free knowledge base -
 Wikinews
Free-content news -
 Wikiquote
Collection of quotations -
 Wikisource
Free-content library -
 Wikispecies
Directory of species -
 Wikiversity
Free learning tools -
 Wikivoyage
Free travel guide -
 Wiktionary
Dictionary and thesaurus


