
File:Clm 14436 ecliptic diagram.png
Original file (2,290 × 1,409 pixels, file size: 1.81 MB, MIME type: image/png)
| This is a file from the Wikimedia Commons. Information from its description page there is shown below. Commons is a freely licensed media file repository. You can help. |
Summary
| Description |
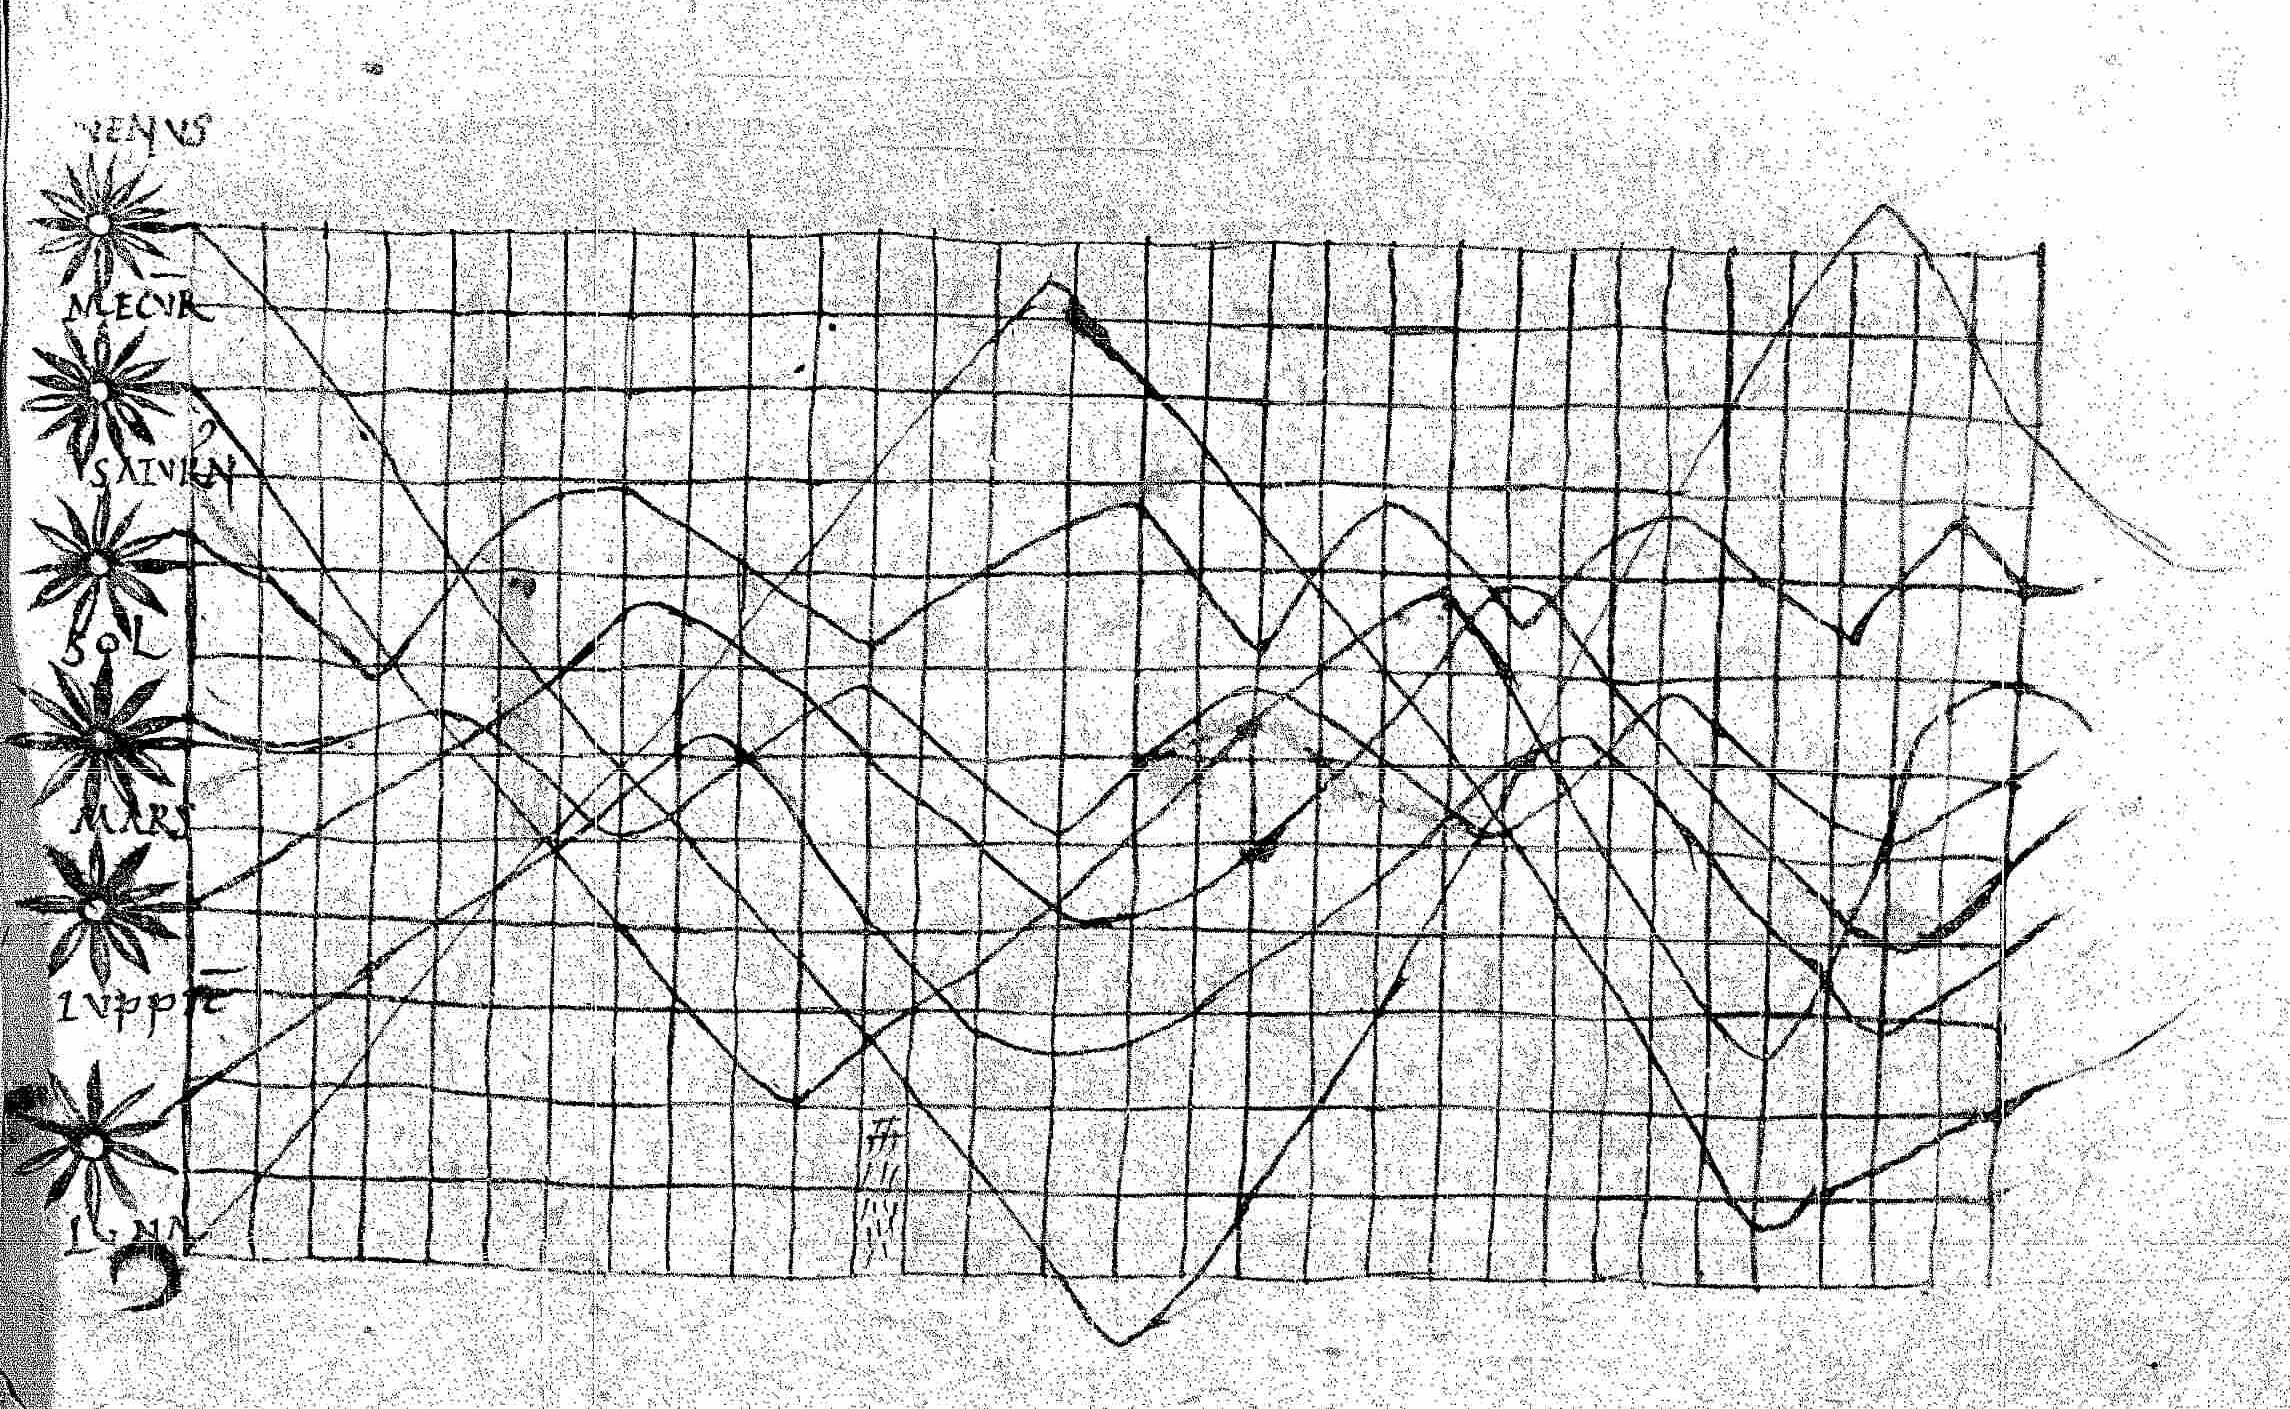
English: Graph of planetary movements, given as an illustration to a short appendix, titled De cursu per zodiacum, to a copy of Macrobius' Commentary on Cicero's Somnium Scipionis.
This is an early 2-dimensional chart (plotting time vs. celestial latitude; an apparent anomaly is that it appears to show the celestial latitude of the sun varying with time); apparently, this diagram has precedents, in the Carolingian "Handbook of 809" and even in Bede (Ramirez-Weaver 2008). The scribe used horizontal and vertical lines as aids, resulting in a picture strikingly similar to modern graph paper as it did not become commonly used before the mid 19th century, some 800 years later. CLM 14436, a convolute of four mss. of the first quarter of the 11th century (formerly also dated to the late 10th century), substantial portions are written by one Hartwic. The contents reflect the subject matter taught at the large French monastery schools at the time. Hartwic may be identical with the later abbot of St. Emmeram in Regensburg; he studied in Chartres under bishop Fulbert, and this manuscript are presumably his "lecture notes" which he produced in Chartres and later took back to his home monastery of St. Emmeram. The ms. remained in possession of St. Emmeram monastery until 1811, when it was acquired by the Bayerische Staatsbibliothek. Literature:
|
| Date | circa 1010 |
| Source | CLM 14436 fol. 61r |
| Author | Hartwic(?) |
| Other versions |
 |
Licensing
|
This work is in the public domain in its country of origin and other countries and areas where the copyright term is the author's life plus 100 years or fewer. | |
| This file has been identified as being free of known restrictions under copyright law, including all related and neighboring rights. | |
File history
Click on a date/time to view the file as it appeared at that time.
| Date/Time | Thumbnail | Dimensions | User | Comment | |
|---|---|---|---|---|---|
| current | 18:13, 18 April 2020 | | 2,290 × 1,409 (1.81 MB) | Sette-quattro | higher quality |
| 08:40, 30 June 2013 |  | 1,258 × 710 (509 KB) | Dbachmann | {{Information |Description ={{en|1=Planetary Movements, depicted as Cyclic Lines on a Spacial-Temporal Grid. In ''De cursu zodiacum'' (by Pliny?), given as an appendix to a copy of Macrobius' Commentary on Cicero's ''Somnium Scipionis'' (CLM 14436,... |
File usage
Global file usage
The following other wikis use this file:
- Usage on en.wikiquote.org